General-purpose languages are the most widely used by programmers all over the world because they allow the possibility of developing projects with different profiles. R is not one of these. It is a syntax that is used for handling large volumes of data, normally of a statistical kind, and with a single objective: to display them so they can be understood. Even so, it has become increasingly popular.
Why has R become such an interesting option?
1. Robust language.
R is a language with a steep learning curve, but which is very robust and effective for handling statistical data. This is an object-oriented language, very similar to the syntaxes C and C++. For developers who are expert in these languages, it may be simple. R is also a programming language that's constantly evolving, and for which there is ample documentation available.
2. It's easy to prepare the data.
When a programmer handles very high volumes of data, a large part of his or her time is spent preparing the information for display before any conclusions can be drawn from it. With R, this preparation is relatively simple, largely because it automates a number of processes by programming scripts.
3. R works with any file type.
R is very flexible, and can work with data from all file types: a .txt, un .csv, a JSON or an EXCEL…
4. It manages large volumes of data.
R is a language that allows the implementation of additional packages, which gives it an enormous capacity for data management. In large volume projects, scalability is a key element.
5. It's open source and free.
If you're a programmer and you want to start using R, this is an important point. There are no limitations. The code is in the repository of any collaborative development platform like GitHub, or on developers' forums like Stackoverflow. There are additional libraries and packages to develop special projects, whose code can be modified according to your liking in order to implement new functionalities. And all for free.
6. Visualizations: Who's going to understand if there are no graphics?
If there's anything that defines R, it's its capacity for displaying complex information in a simple way. All developers have libraries specializing in data visualization to create graphics.
How can I begin to use R to work with data?
To install R in your computer, go to the CRAN project (Comprehensive R Archive Network) and download the .exe for Linux, Mac OS X or Windows. Once you've done that, follow the usual process for any program or web application installed in an operating system:
– Run the .exe file. If this is the first time you're installing R in your computer, you'll have no problem. If you have an earlier version of R installed in your computer, the best idea is to uninstall it first.
– After choosing the language, the user goes through the installation process on a series of different screens.
– You need to choose a folder to store R.
– There are two types of installation: user (standard) or full.
CRAN has a full list of R packages in alphabetical order. You'll find source code and documentation. Each package also includes information on its functionalities.
Like any other syntax, a developer must use an integrated development environment (IDE) to program a project. In the case of R, one of the most commonly used is RStudio. This IDE has a console and a text editor, with some features like syntax highlighting, error debugger, code auto-complete, advanced work directory manager and more.
What are the best libraries for R?
1. Data handling
– plyr: This R package allows operations to be made in the subgroups of a large dataset. It has different functions for operating with these data: ddply, daply, dlply, adply and ldply. How can you begin to work with it?
– Installation: use the function install.packages (“plyr”).
– Load the library: use the command library (“plyr”).
– How to apply operations within a dataset included within the plyr package in R: We can use statistical data on baseball players data (baseball) and begin to operate with them to find out –for example– a player's minimum and maximum games per year:
ddply(baseball, .(id), function(x) c(years=nrow(x), minimum=min(x$g), maximum=max(x$g)))
This process of installation and running packages in R is the same for all the packages. install.packages function to install the package and the library function to load it.
– reshape2: This R package transforms data between wide and long formats. It's based on two key functions: melt and cast. Melt takes wide-format data and melts it into long-format data. The cast function does the same in reverse.
Wide-format data have one column for each variable. The long format has one column for each type of variable and another for the values of these variables. With the reshape2 package functions you can easily transform a dataset from one format to the other. Practical case.
Other R packages for data handling: lubridate and stringr.
2. Data visualization
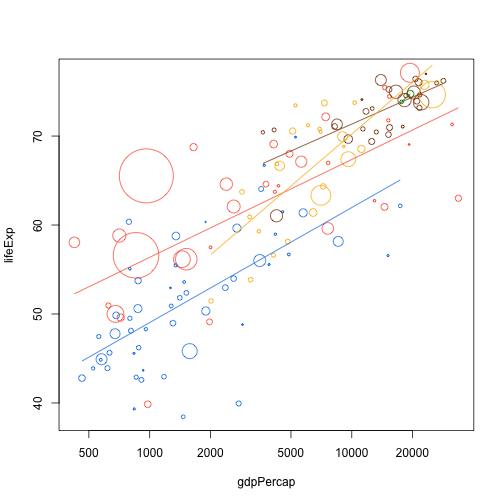
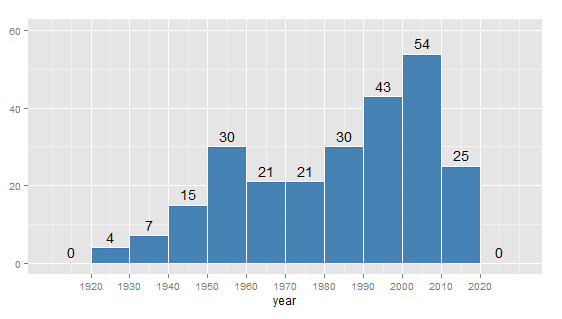
– ggplot2: This is a package that provides R with everything it needs to create graphics in an accessible way. It's a really powerful library: It allows all types of visualizations (bars, points, lines, areas and more); and it has a system of coordinates for making map graphics and scales. ggplot2 can be combined with other libraries to create data trends, for example.
ggplot2 is not part of R's standard installation package, so you need to download it and specifically include it. Once downloaded, there are two functions for installing and executing:
– install.packages (“ggplot2”) function to install it.
– And we use the library function (“ggplot2”) to load it.
The R package ggplot2 depends on other packages that must also be downloaded and installed such as ‘itertools’, ‘iterators’, ‘reshape’, ‘proto’, ‘plyr’, ‘RColorBrewer’, ’digest’ and ‘colorspace’.
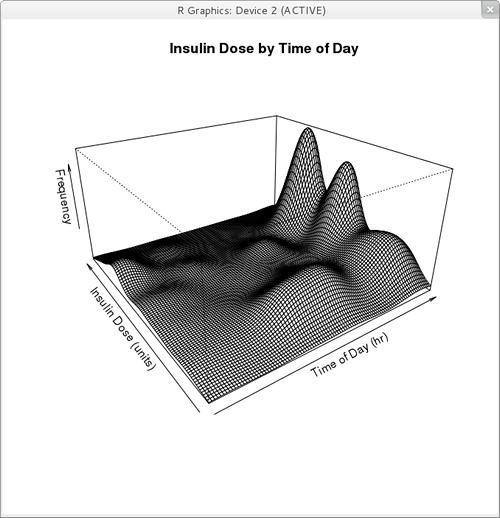
– rgl: Package for the creation of 3D graphics in real-time. It uses an OpenGL rendering backend (Open Graphics Library, a standard specification that defines a set of functions for writing data visualization applications).
3. Automatic learning
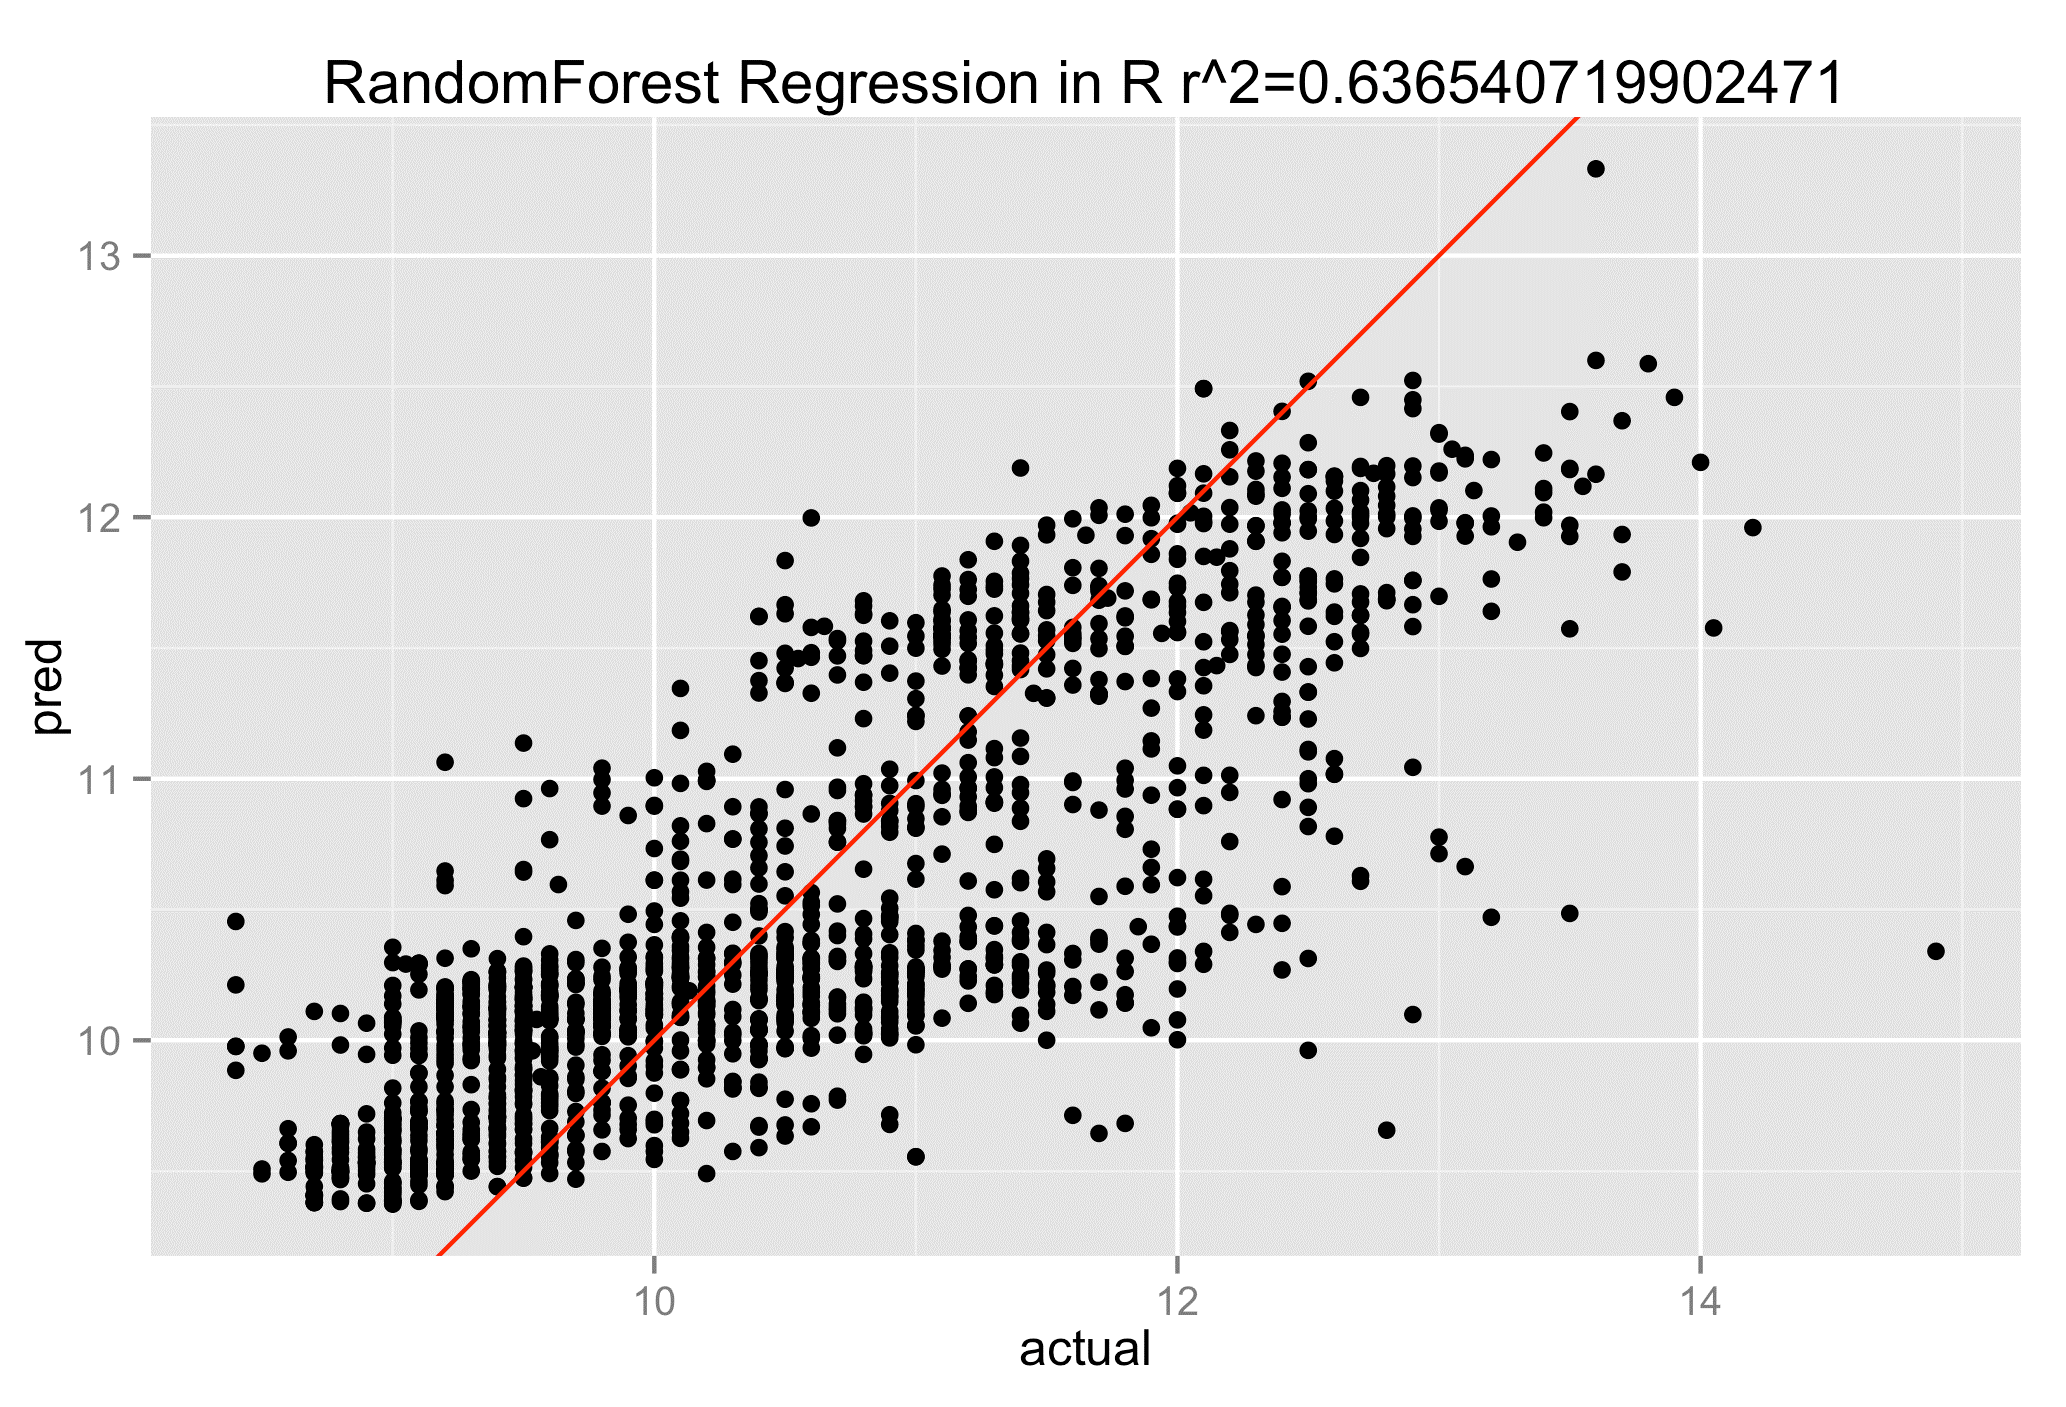
– randomforest: This is classification method that uses decision trees (a standard machine learning technique) applied to large volumes of data. It can be used for both supervised and unsupervised learning.
This method has some important features:
– It is efficient in large databases.
– It enables the management of thousands of input variables without the need to delete any variables.
– The decision trees created in one project can be used for other datasets in the future.
– It has a function for estimating missing data. This allows the method to maintain its accuracy, even when there is no access to certain data.
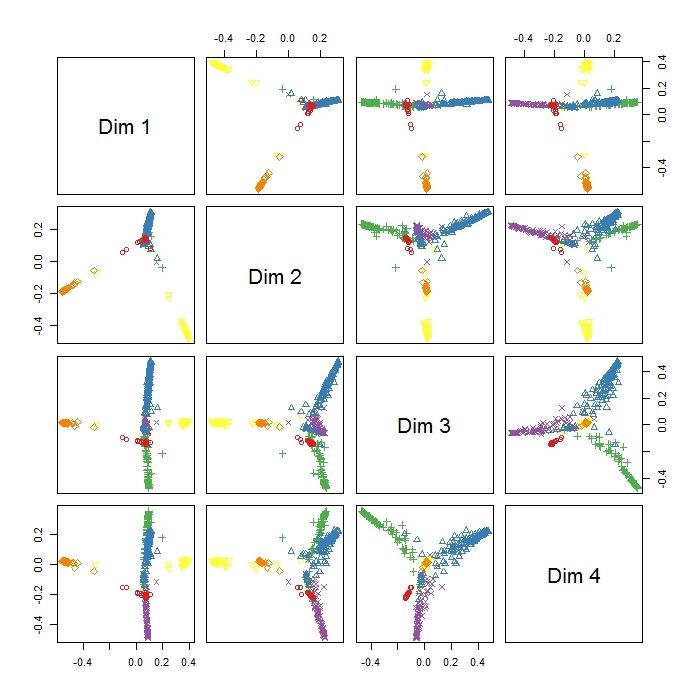
– randomForestSRC: Method of random forests for survival, regression and classification.
A random forest for survival is a mathematical tool that allows a large number of variables to be weighted in order to generate a predictive model of survival, and is normally used within the healthcare sector.
Classification trees are used when the response or target variable is categorical. In contrast, regression trees are used when the response variable is numerical. This is the difference between a classification and a prediction model.
Among the other R packages widely used by data scientists:
– Gradient boosting: gbm and xgboost.
– Support vector machines: e1071, LiblineaR and kernlab.
– Regression with regularization: glmnet.
– Generalized additive models: gam.
– Clustering: cluster.
Follow us on @BBVAAPIMarket