There are many companies using APIs to manage their data and develop their business. Many tools can be used to monitor how these APIs work.
Reducing costs, creating applications, designing predictive models, etc. There are many companies that use APIs to increase their competitiveness, explore and discover new markets and diversify their business. However, these new opportunities depend on monitoring how these APIs operate.
Mashape Analytics, Akana Envision and CA App Synthetic Monitor are three of the professionals tools used to measure the performance of application programming interfaces in real time. Thanks to these platforms, the development teams can keep track of performance at all times and act to solve errors.
1. Mashape Analytics
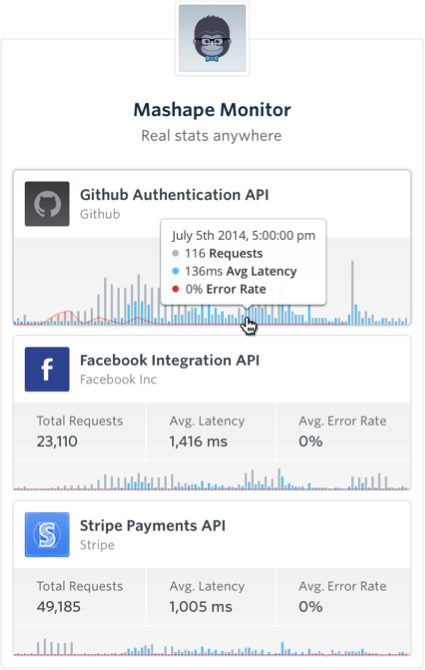
Mashape Analytics has been created internally by Mashape with the aim of controlling and measuring the performance of over 13,000 APIs used by Mashape itself to develop its microservices infrastructure, and by other companies such as Amazon, Citibank, Accenture, DHL and NASA.
Mashape claims that this tool was created to fill a gap in the market: monitoring the performance of microservices infrastructures and APIs for modern development teams. This analysis solution offers the following features:
– Real-time data: Analysis of the performance, consumption and use of an API in real time. It also measures the average latency time of the activity or errors, both on the customer’s and the server’s sides. In the final phase, the platform provides this information in a drill-down by points.
– Custom dashboards: Development teams can create dashboards to prepare reports and create filters among other options. This tool could be called the “Google Analytics of APIs”.
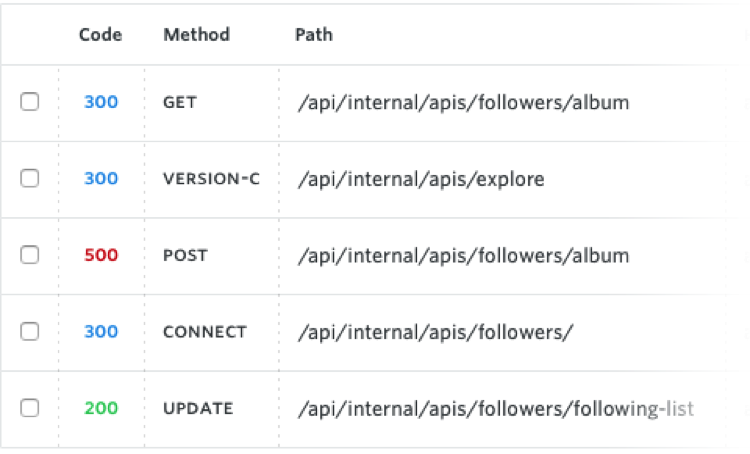
– API logs: Everything that happens in a microservices infrastructure can be logged. Development teams can access these logs as they arrive and, consequently, debug errors more easily.
– Alerts: Systems that sends real-time notifications to the technical team regarding the overload or mismanagement of infrastructure resources, or notifications about the actual API status. These alerts are sent via email or push notifications.
– Request for repetition: A second identical request can be raised to check that the performance response for the first log meets the predefined goal.
2. Akana Envision
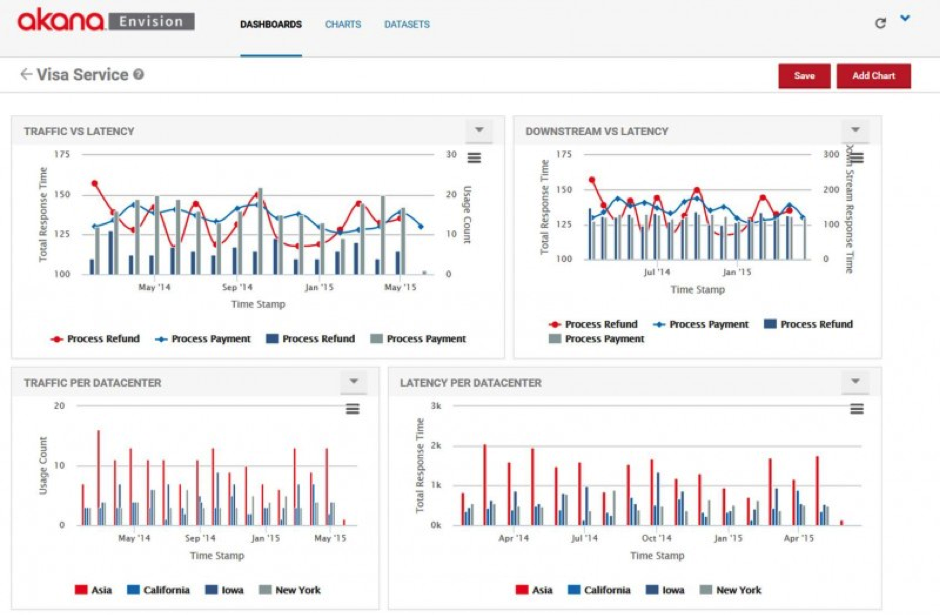
Akana’s platform provides companies with the ability to reach conclusions based on information from their APIs and data about the performance of these interfaces, with the aim of managing and exchanging data among the APIs. Envision is a scalable and customizable tool. It can be used as the main platform to analyze complex data and how the APIs work, or integrated into an existing tool to avoid duplicates in the IT infrastructure.
With Envision, a group of developers can:
– Track product trends.
– Identify new business ideas and opportunities.
– Discover the best available APIs for each type of application, platform, channel or monetization outlook.
– Analyze whether or not the infrastructure responds to requests from devices and locations correctly, and whether or not it reacts to the type of requests correctly.
– Manage APIs. For example, troubleshooting.
Some of its main features include:
– Data lake: Storage of raw data for future use or analysis.
This tool allows you to monitor APIs and web services in the cloud. The platform simulates the complete workflow of an API and reproduces it from any of the measurement and monitoring stations in the CA App Synthetic Monitor. The tool aims to replicate the end user experience to determine the status and availability of every application and identify possible errors.
Its main features are as follows:
– Replicate transactions by actual users from 94 monitoring stations in six continents so as to provide real-time, minute-by-minute API performance control and measurement.
– Performance monitoring of the company’s APIs and third party APIs. Performance monitoring of web services, including users.
– Alerts to react to problems involving API performance as soon as possible. These alerts contain all the necessary information: a timestamp, the script name, the type of API error, etc. Alert notifications can be set up in the tool’s console and sent via email, SMS, XMPP/Jabber, MSN, RSS or SNMP, or sent to a webpage (API). There is a log of when these alerts are received.
– Creation of customer reports: Statistics by time, day, week, month and year regarding availability and response times. All reports can be downloaded as a PDF or Excel file or using the API and sent via email, either manually or automatically. Real-time views (also available in interactive flash format) can also be downloaded as PNG.
– Data availability is variable: 30 days for non-processed data, 48 hours for analysis data about the root cause, and 4 months for statistical data.
– Monitoring of APIs and web services in the cloud is compatible with any type of API: REST, SOAP, oAuth, JSON, XML, RSS, openID…
Configuration of dashboards from the CA App Synthetic Monitor’s console. The default dashboard includes historical data and the latest alerts. All this is real-time information. Aggregate script results can also be displayed in the monitoring dashboard.
Businesses, from self-employed to SMEs and large companies, need financing solutions that suit their needs. Leasing is a method that can optimize the use of resources and which combines business liquidity (or lack of) with the use of assets. What is leasing and how does it work? Leasing is a financing method by which a […]
An API is a very useful mechanism that connects two pieces of software equipment to exchange messages or data in a standard format such as XML or JSON. Thus, it becomes an instrument that can be used to search for revenue, open the doors to talent or innovate and automate processes.
There are companies that collect and store bank data: information on accounts, transactions, credit-card operations, loans, investments... These companies' APIs give entities access to new markets and new customers.
Please, if you can't find it, check your spam folder
×
The email message with your ebook is on the way
We have sent you two messages. One with the requested ebook and one to confirm your email address and start receiving the newsletter and/or other commercial communications from BBVA API_Market
×
PROCESSING OF PERSONAL DATA
Who is the Data Controller of your personal data?
Banco Bilbao Vizcaya Argentaria, S.A. (“BBVA“) with registered address at Plaza de San Nicolás 4, 48005, Bilbao, España and Tax ID number A-48265169 . Email address: contact.bbvaapimarket@bbva.com
What for and why does BBVA use your personal data for?
For those activities among the following for which you give your consent by checking the corresponding box:
to receive newsletter from BBVA API_Market through electronic means;
to send you commercial communications, events and surveys relating to BBVA API_Market to the e-mail address you have provided.
For how long we will keep your data?
We will keep your data until you unsubscribe from receiving our newsletter or, if applicable, the commercial communications, events and surveys to which you have subscribed. Whether you unsubscribe or whether BBVA decides to end the service, your details will be deleted.
How can I unsubscribe to stop receiving newsletters and/or communications from BBVA API_Market?
You can unsubscribe at any time and without need to indicate any justification, by sending an email to the following address: contact.bbvaapimarket@bbva.com
To whom will we communicate your data?
We will not transfer your personal data to third parties, unless it is mandatory by a law or if you have previously agreed to do so.
What are your rights when you provide us with your information?
You will be able to consult your personal data included in BBVA files (access right)
You can modify your personal data when they are inaccurate (correction right)
You may request that your personal data not be processed (opposition right)
You may request your personal data be deleted (suppression right)
You can request a limitation on the processing of your data in the allowed cases (right of limitation of processing)
You will be able to receive, in electronic format, the personal data you have provided to us, as well as to transmit them to another entity (portability right)
You are responsible for the accuracy of the personal data you provide to BBVA and to keep them duly updated. If you believe that we have not processed your personal data in accordance with regulations, you can contact the Data Protection Officer of BBVA at the following address dpogrupobbva@bbva.com.
You can find more information in the “Personal Data Protection Policy” document on this website.
×
PROCESSING OF PERSONAL DATA
Who is the Data Controller of your personal data? Banco Bilbao Vizcaya Argentaria, S.A (“BBVA“), with registered address at Plaza de San Nicolás 4, 48005, Bilbao, España, and Tax ID No. A-48265169. Email address:contact.bbvaapimarket@bbva.com
What for and why does BBVA use your personal data for?
For the execution and management of your request, specifically, download the requested e-book/s.
BBVA informs you that, unless you indicate your opposition by sending an email to the following address: contact.bbvaapimarket@bbva.com, BBVA may send you commercial communications, surveys and events related to products and/or services of BBVA API Market through electronic means.
For how long we will keep your data?
We will keep your data as long as necessary for the management of your request, and to receive commercial communications, events and surveys. BBVA will keep your data until you unsubscribe to stop receiving our newsletters or, where appropriate, until the end of the service. Afterwards, we will destroy your data.
How can I unsubscribe to stop receiving newsletters and/or communications from BBVA API Market?
You can unsubscribe at any time and without need to indicate any justification, by sending an email to the following address: contact.bbvaapimarket@bbva.com
To whom will we communicate your data?
We will not transfer your personal data to third parties, unless it is mandatory by a law or if you have previously agreed to do so.
What are your rights when you provide us with your information?
You will be able to consult your personal data included in BBVA files (access right)
You can modify your personal data when they are inaccurate (correction right)
You may request that your personal data not be processed (opposition right)
You may request your personal data be deleted (suppression right)
You can request a limitation on the processing of your data in the allowed cases (right of limitation of processing)
You will be able to receive, in electronic format, the personal data you have provided to us, as well as to transmit them to another entity (portability right)
You can exercise before BBVA the aforementioned rights through the following address: contact.bbvaapimarket@bbva.com
You are responsible for the accuracy of the personal data you provide to BBVA and to keep them duly updated.
If you believe that we have not processed your personal data in accordance with the regulations, you can contact the Data Protection Officer at the following address: dpogrupobbva@bbva.com
You can find more information in the “Personal Data Protection Policy” document on this website.
Banco Bilbao Vizcaya Argentaria, S.A. owner of this portal uses cookies and/or similar technologies of its own and third parties for the purposes of personalization, analytics, behavioral advertising or advertising related to your preferences based on a profile prepared from your browsing habits (e.g. pages visited). If you wish to obtain more detailed information, consult our Cookies Policy.
Cookie settings panel
These are the advanced settings for first-party and third-party cookies. Here you can change the parameters that will affect your browsing experience on this website.
Technical Cookies (required)
These cookies are used to give you secure access to areas with personal information and to identify you when you log in.
Name
Owner
Duration
Description
gobp.lang
BBVA
1 month
Language preference
aceptarCookies
BBVA
1 year
Configuration Accepted Cookies
_abck
BBVA
1 year
Helps protect against malicious website attacks
bm_sz
BBVA
4 hours
Helps protect against malicious website attacks
ADRUM_BTs
Salesforce Marketing Cloud
Session
Required for monitoring of the service, inherent to SFMC
ADRUM_BT1
Salesforce Marketing Cloud
Session
Required for monitoring of the service, inherent to SFMC
ADRUM_BTa
Salesforce Marketing Cloud
Session
Required for monitoring of the service, inherent to SFMC
ADRUM_BT
Salesforce Marketing Cloud
Session
Required for monitoring of the service, inherent to SFMC
xt_0d95e
Salesforce Marketing Cloud
Session
Remember user preferences (if any)
__s9744cdb192d044faa1bf201d29fafd1e
Salesforce Marketing Cloud
Session
Remember user preferences (if any)
wpml_browser_redirect_test
WPML
Session
Text translation in the portal
wp-wpml_current_language
WPML
24 hours
Text translation in the portal
They are used to track the activity or number of visits anonymously. Thanks to them we can constantly improve your browsing experience
Your browsing experience is constantly improving.
With your selection, we cannot offer you a continuously improved browsing experience.
Name
Owner
Duration
Description
AMCV_***
Adobe Analytics
Session
Unique Visitor IDs used in Cloud Marketing solutions
AMCVS_***
Adobe Analytics
2 years
Unique Visitor IDs used in Cloud Marketing solutions
demdex (safari)
Adobe Analytics
180 days
Create and store unique and persistent identifiers
sessionID
Adobe Analytics
Session
Launch's internal cookie used to identify the user
gpv_URL
Adobe Analytics
Session
Adobe Analytics plugin: getPreviousValue Capture the value of a certain variable in the following page view, in this case the prop1
gpv_level1
Adobe Analytics
Session
Cookie used to store the DataLayer levl1 of the previous page.
gpv_pageIntent
Adobe Analytics
Session
Cookie used to store the pageIntent of the previous page.
gpv_pageName
Adobe Analytics
Session
Cookie used to store the pagename of the previous page.
aocs
Adobe Analytics
Session
Cookie that stores the first values collected at the beginning of a process.
TTC
Adobe Analytics
Session
Cookie used to store the time between the App Page Visit event and the App Completed event.
TTCL
Adobe Analytics
Session
Cookie used to store the time between the LogIn event and App Completed.
s_cc
Adobe Analytics
Session
Determine if cookies are active
s_hc
Adobe Analytics
Session
Cookie used by Adobe for analytical purposes
s_ht
Adobe Analytics
Session
Cookie used by Adobe for analytical purposes
s_nr
Adobe Analytics
2 years
Determine the number of user visits
s_ppv
Adobe Analytics
Permanent
Adobe Analytics plugin: getPercentPageViewed Determine what percentage of the page a user views
s_sq
Adobe Analytics
Session
ClickMap/ActivityMap features
s_tp
Adobe Analytics
Session
Cookie used by Adobe for analytical purposes
s_visit
Adobe Analytics
2 years
Cookie used by Adobe to know when a session has been started.
They allow the advertising shown to you to be customized and relevant to you. Thanks to these cookies, you will not see ads that you are not interested in.
The advertising is customized to you and your preferences.
Your choice means you will not see customized ads, only generic ones.
Name
Owner
Duration
Description
OT2
VersaTag
90 days
VersaTag Cookie used to store a user id and the number of user visits.
u2
VersaTag
90 days
VersaTag Cookie where the user ID is stored
TargetingInfo 2
MediaMind
1 year
Cookie that serves to assign a unique random number that generates MediaMind.
These cookies are related to general features such as the browser you use.
Your experience and content have been customized.
With your selection, we cannot offer you a continuously improved browsing experience.
Name
Owner
Duration
Description
mbox
Adobe Target
9 days
Cookie used by Adobe Target to test user experience customization.
×
Looks like you’re browsing from Mexico, so let’s show you the custom content for your
location. Change
Looks like you’re browsing from Spain, so let’s show you the custom content for your
location. Change
Select a country
In order to access the private area and corresponding sandbox, select the country of the APIs you want to use.